Frequently Asked Questions
- What is SWC format?
- Is there a difference in the metric for different data sets other than dimensionality?
- How can we set the matching threshold?
- In the first data set, "Cerebellar Climbing Fibers", the individual planes are merges of a panel of capture stacks. Distortions in neuron shape are visible at some of the boundaries. Is it possible to either fix it, or in addition, release the data as individual stacks that need to be merged?
- Do different datasets have drastically different thresholds?
- Is the source code for the DIADEM metric (scoring function) available?
- Why is the DIADEM metric so complex? Was the choice somewhat arbitrary?
- What program can be used to open the .rar data set files? Is there a free, downloadable program for this?
- Is the output of the algorithm supposed to be the "segmented" tree, i.e. a binary file in which the voxels representing the neuron have one value and everything else have a different value? Or is the "digital reconstruction" simply the 1-voxel thick centerline that can be extracted from this segmentation, which then allows for determining interbranch length, bifurcation and termination nodes etc.?
- Are edge-detection, image thresholding, and tree enhancing filters part of the purpose of the challenge?
- In the manual reconstructions provided for the Olfactory Projection training data set, some of the branch points appear slightly misaligned with the underlying labeled structure. Will this affect the scoring?
- In the manual reconstructions provided for the Olfactory Projection training data set, some of the termination points appear to vary in terms of distance from the underlying labeled structures. Will this affect the scoring?
- Does the metric account for possible floating point error in determining whether a node is within threshold distance in the Z-direction?
- In the swc file, does column 2 (type or tag of the tracing point) influence the scores, that is, should the program correctly determine whether it is an axon or a dendrite?
- The same branch between two bifurcations can be divided by intermediate points differently. Does this choice affect the score?
- The DIADEM metric provides a dramatically incorrect score and/or ignores a large portion of my SWC file. What am I doing wrong?
- In some data sets, there are several branches that I would have manually traced differently than the training reconstruction. How can these be considered objective gold standards to evaluate automated tracings?
Q. What is SWC format?
A. A file in SWC format contains information representing a
digitally reconstructed neuron. SWC is non-proprietary and
stores the minimum amount of parameters required to represent a
vector-based three-dimensional reconstruction. Files may begin
with headers above the data values, each beginning with #.
Parameters are organized into 7 columns, where each row within
the column represents one trace point. From left to right these
columns are: unique identity value for trace point, structure
type, x coordinate, y coordinate, z coordinate, radius, identity
value for parent (i.e. trace point that comes before and
connects to the current trace point). The first 10 points of an
example SWC file are provided below:
#Example header text here
1 2 4882 1797 19 9 -1
2 2 4882 1797 19 9 1
3 2 4875 1821 19 9 2
4 2 4852 1849 19 21 3
5 2 4842 1827 18 12 4
6 2 4835 1816 18 7 5
7 2 4827 1807 18 7 6
8 2 4814 1797 18 4 3
9 2 4803 1785 18 4 8
10 2 4785 1763 18 4 9
The bolded row represents one trace point which has been given an identity = 3, type = 2 (i.e. axon), X = 4875, Y = 1821, Z = 19, radius = 9, and trace point 2 is its parent (i.e. the trace point represented in the row directly above it).
Columns 1,2, and 7 are always integers. Columns 3,4,5, and 6 represent whatever units were used in the reconstructions process (e.g. pixels, micometers, etc.) and can have decimal points.
Column 1 (Identity #) must always increase in value by 1 whereas the column 7 (Parent Identity #) values have no such restriction but must be less than column 1 in the same row. Note that both rows 4 and 8 in the above example connect directly to row 3, meaning that row 3 must be a bifurcation point.
Row 1 has a parent = -1, which means that this row does not have a parent and is thus the root of the reconstruction.The commonly accepted values for Column 2 that are pertinent to the DIADEM datasets are: 1 = cell body; 2 = axon; and 3 = dendrite.
Q. Is there a difference in the metric for different data
sets other than dimensionality?
A. There are a number of differences in the metric between
datasets which are detailed on the individual dataset readme
pages (except for the threshold differences).
The thresholds, both distance and path length error
thresholds, are different to account for the resolution
in both XY and Z directions. The thresholds for spur
(a small terminal branch) removal vary by dataset as well
(some don't remover spurs). Also, the Neuromuscular
projection dataset handles terminations in a different
manner because of the rosette structures.
The manual reconstructions end at the beginning of those
structures, but the metric will not punish automated
reconstructions that trace into the rosette structures.
Q. How can we set the matching threshold?
A. The readme for the current (post-competition) version of the metric
describes how threshold parameters can be set.
Q. In first data set, "Cerebellar Climbing Fibers",
the individual planes are merges of a panel of capture
stacks. Distortions in neuron shape are visible at some
of the boundaries. Is it possible to either
fix it, or in addition, release the data as individual
stacks that need to be merged?
A. Merging was not performed by hand, but with the leading
software controlling the motorized stage of the microscope.
Mechanical error limits in stage movement are evident at
the small scale of climbing fibers though they are not large
enough to impair manual tracing.
The released data set corresponds to the original acquired
images and was not tiled in a post-processing step.
Thus, individual panel stacks are not available.
Although the results may not be optimal, they are
representative of the typical experimental configuration
in a modern neuroanatomy lab.
Q. Do different datasets have drastically different
thresholds?
A. Yes. The thresholds are as follows:
Cerebellar Climbing Fiber
XY Euclidean Distance: 37.33 pixels (1.4 microns)
Z Euclidean Distance: 4 images (1.3 microns)
XY Path Error: 0.075
Z Path Error: 0.18
Hippocampal CA3 Interneuron
XY Euclidean Distance: 11 pixels (2.4 microns)
Z Euclidean Distance: 14 images (4.67 microns)
XY Path Error: 0.08
Z Path Error: N/A
Neocortical Layer 1 Axon
XY Euclidean Distance: 4.76 pixels (1.4 microns)
Z Euclidean Distance: 5 images (5 microns)
XY Path Error: 0.07
Z Path Error: 0.18
Neuromuscular Projection Fiber
XY Euclidean Distance: 32 pixels (1.2 microns)
Z Euclidean Distance: N/A
XY Path Error: 0.04
Z Path Error: N/A
Olfactory Projection Fiber
XY Euclidean Distance: 3.94 pixels (1.3 microns)
Z Euclidean Distance: 5 images (5 microns)
XY Path Error: 0.08
Z Path Error: 0.2
Visual Cortical Layer 6 Neuron
XY Euclidean Distance: 9 pixels
Z Euclidean Distance: 6 images
XY Path Error: 0.08
Z Path Error: 0.2
Q. Is the source code for the DIADEM metric
(scoring function) available?
A. Yes, it can be downloaded
here.
The following are the MD5sums for the DIADEM metric source code:
If downloaded on/after May 7, 2012:
2b06bbe336d763e269ef2555d7c4c3ef
If downloaded between February 19, 2010 and May 7, 2012:
a7c9daa3564e947e22f0b707a0bb3a95
If downloaded between January 26, 2010 and February 19, 2010:
82368ef91ede897b87559d24909e80f6
If downloaded between November 25, 2009 and January 26, 2010:
14d147ba30e84de13d343fb349c70ca2
If downloaded before November 25, 2009:
4b1b8cb075e53b7f45fb9c3e65c79ce1
Q. Why is the DIADEM metric so complex?
Was the choice somewhat arbitrary?
A. The metric implements our best attempt to quantify the human judgement
of what differentiates a good reconstruction from a bad one. Since we agreed
on a "manual" gold standard, there is some inherent arbitrariness.
The basic idea is simple: the nodes of the trees should be in the right
position, their topological interconnectivity should be accurate,
and the path distance in reasonable range. However, there are many
different cases of possible "errors" or "variations", and these are
judged differently depending on the impact they have on the overall structure.
Moreover, the various datasets have different characteristics (representative
of experimental diversity encountered in real-lab scenarios) which are
reflected in additional requirements. These qualifications account for most
of the metric complexity.
Q. What program can be used to open the .rar data set files?
Is there a free, downloadable program for this?
A. Please carefully read the
Data Set General Readme on the website.
It indicates PeaZip as one example.
A possible alternative is Zipgenius.
These were both free last time we checked.
A google search for ".rar" will find many other hits. As usual with freeware, read carefully during installation to make sure you uncheck any add-on programs you don't want. PeaZip didn't have any last time we checked, but just in case...
Q. Is the output of the algorithm supposed to be the "segmented" tree, i.e.
a binary file in which the voxels representing the neuron have one value and
everything else have a different value? Or is the "digital reconstruction"
simply the 1-voxel thick centerline that can be extracted from this
segmentation, which then allows for determining interbranch length,
bifurcation and termination nodes etc.?
A. A digital reconstruction, the output of the algorithm, consists of series
of interconnected vectors, not voxels. Although in principle each of these
vectors is associated with a thickness, the DIADEM metric only considers the
branching topology, path distance, and position of the nodes, thus diameter
does not affect the computation of the score.
Q. Are edge-detection, image thresholding, and tree enhancing filters part
of the purpose of the challenge?
A. Any methods that can help automating the production of digital
reconstructions from sets of images may be relevant to the DIADEM challenge.
Q. In the manual reconstructions provided for the Olfactory Projection training
data set, some of the branch points appear slightly misaligned with the
underlying labeled structure. Will this affect the scoring?
A. An example of a branch point that appears slightly misaligned with the
underlying structure (from the OP_2 Training Round data set) is shown in the
figure below (red arrow).
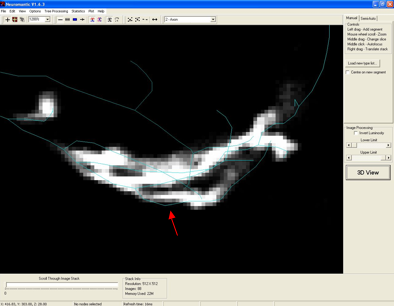
Manual reconstructions have been tested to see if these points affect scoring.
Specifically, a correctly re-aligned reconstruction was compared to the
original file included in one of the data sets. None of the non-terminating
nodes were missed (see next FAQ for further observations on terminating nodes).
We have therefore left the reconstructions as they were originally traced.
Q. In the manual reconstructions provided for the Olfactory Projection training
data set, some of the termination points appear to vary in terms of distance
from the underlying labeled structures. Will this affect the scoring?
A. An example of two terminations points that end at varying distances compared
to the underlying structures (from the OP_2 Training Round data set) is shown
in the figure below (red arrows).
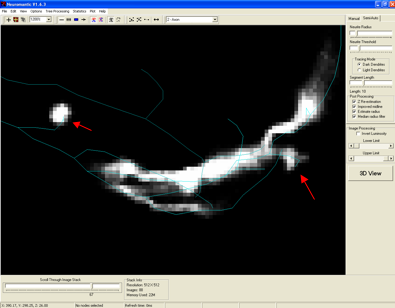
Manual reconstructions have been tested to see if variation in the positions of
termination trace points affects scoring. Specifically, a correctly re-aligned
reconstruction was compared to the original file included in one of the data
sets. Two terminal nodes were missed, resulting in a final score of 0.989.
This score is nearly perfect and well within the typical range observed between
two manual reconstructions by independent experts from the same underlying
image stack. Because such minor differences are unlikely to affect algorithm
rankings, we left the traces as they were originally traced.
Q. Does the metric account for possible floating point error in determining
whether a node is within threshold distance in the Z-direction?
A. The current version of the metric provides a
small additional margin to the Z component of the distance threshold in order
to ensure that no floating point error can affect scoring.
Q. In the swc file, does column 2 (type or tag of the tracing point) influence
the scores, that is, should the program correctly determine whether it is an
axon or a dendrite?
A. No
Q. The same branch between two bifurcations can be divided by intermediate
points differently. Does this choice affect the score?
A. The metric is based on the location of the nodes (bifurcations and
terminations), but the distance along the path does affect the computation of
the score (as explained in the Rules of the competition). Therefore, the
intermediate points should follow the image path as accurately as it is
necessary to ensure that the branch path length is accurately reproduced.
Q. The DIADEM metric provides a dramatically incorrect score and/or ignores a
large portion of my SWC file. What am I doing wrong?
A. Most likely you have an older release of the metric
(version prior to 11/25/2009) and need to download the more recent version.
An error in the previous release of the metric occurred if any line of data
did not contain the precise formatting expected (e.g. tabs between data, any
character other than a normal space at the end of a line).
The line for node 4 in the climbing fiber CF_1.swc contained a tab at the end.
This caused the line to be ignored and thus all descendant nodes could not be
attached to the tree. Ultimately the metric would conclude without a clear
error, but would likely return very poor scores for automated traces run
against the gold standard CF_1.swc. The updated metric ignores any whitespace
at the end of a data line, though any non-whitespace characters
(or any incorrect formatting) causes the program to terminate with an error
message detailing the file and line number of the improper data format.
Tabs and spaces are now treated equally to provide greater flexibility,
though other programs may have more demanding format constraints.
As before, lines beginning with the "#" symbol are seen as comments and are
ignored.
Q. In some data sets, there are several branches that I would have manually
traced differently than the training reconstruction.
How can these be considered objective gold standards to evaluate automated
tracings?
A. Experimental data is sometime ambiguous, and arbitrary choices are
occasionally unavoidable. Lab providers have confirmed that there is
subjectivity in the more complex data sets. The scoring thresholds
should account for much of the subjectivity. If you feel certain that
a point should have been traced differently, it is strongly suggested
that you trace it how you feel it should be traced. Getting hung up trying
to develop an algorithm that works around such problems is
counter-productive to the purpose of DIADEM.